Everyday AI Guides · AI for Design & Creativity
Reviewed and updated: August 1, 2026
An AI infographic generator can turn a prompt, article, report, document, or dataset into a polished visual in minutes. That speed is useful, but a professional-looking layout does not prove that the facts, calculations, chart scales, citations, or conclusions are correct.
Use this AI infographic generator checklist to move from source material to a publishing-ready visual without losing context, overstating the evidence, or hiding important information inside an inaccessible image. It is part of the AI for Design & Creativity library.
Quick Answer: What Should You Check?
Verify the original source, every important fact and calculation, chart axes and units, source attribution, text hierarchy, mobile readability, accessibility alternatives, image rights, private information, and the final exported file. Do not publish when a central claim, chart, source, privacy check, or text alternative cannot be verified.
What Is an AI Infographic Generator?
An AI infographic generator is a design tool that uses artificial intelligence to transform instructions or source material into a visual layout. Depending on the tool, you may be able to start with a short prompt, paste text, upload a document, enter structured data, or describe the type of infographic you need.
The generator may suggest a headline, arrange sections, summarize text, select icons, create charts, recommend colors, and prepare a downloadable image. This can speed up the first draft, especially for beginners who do not want to build every element manually.
The result should still be treated as a draft. Different generators have different editing controls, data-handling practices, export formats, free-plan limitations, and licensing terms. The person publishing the visual remains responsible for checking what it communicates.
Helpful distinction: The AI can organize and visualize information, but it does not automatically become a reliable fact-checker, accessibility reviewer, copyright adviser, or subject-matter expert.
AI Infographic, Presentation, or Brand Guide: Which Page Do You Need?
These resources support different stages of visual communication. Choose the page that matches the actual decision you are making:
| Guide | Use it for | Primary verification focus |
|---|---|---|
| AI Infographic Generator Checklist | A single visual summary for a webpage, social post, report, handout, or print piece | Facts, calculations, charts, citations, hierarchy, accessibility, and exports |
| AI Presentation Maker Checklist | A multi-slide deck designed for live delivery, sharing, or formal presentation | Story flow, slide timing, evidence, charts, accessibility, playback, and rehearsal |
| AI Brand Style Guide | A reusable visual system applied across infographics, slides, thumbnails, pins, and other assets | Colors, typography, image direction, composition, exclusions, and brand consistency |
Use an Evidence-to-Visual Workflow
A reliable infographic starts before the design stage. Separate the evidence work from the visual work so the layout never becomes the source of truth.
- Collect the original sources. Save the report, dataset, official page, research paper, or approved internal document behind each important claim.
- Verify the claims. Use the How to Fact-Check AI Answers workflow to confirm names, dates, quotations, statistics, definitions, and current information.
- Recalculate the numbers. Reproduce percentages, totals, ratios, averages, changes, and conversions outside the infographic generator.
- Choose the visual form. Decide whether each point needs plain text, a table, a chart, a timeline, a process diagram, or no visual encoding at all.
- Create the accessible alternative. Prepare concise alt text plus normal webpage text or a structured table containing the essential information.
- Export and test. Open the independent file at its real publishing size and review it on the devices and platforms where people will see it.
Working rule: The source document and verification log control the infographic. Never treat the generated visual as the master record for facts or data.
Why AI-Generated Infographics Need Human Review
A polished design can create an impression of authority. Readers may assume that a professional-looking chart or statistic has already been verified, even when the visual was generated from an incomplete prompt or an unreliable source.
An AI-generated infographic may:
- Shorten a statement until its original meaning changes.
- Invent a statistic, source, quotation, date, or organization.
- Mix figures from different countries or time periods.
- Confuse percentages with percentage-point changes.
- Use a chart type that exaggerates or hides a difference.
- Remove limitations that were included in the original research.
- Create unreadable labels, icons, or decorative text.
- Use imagery that is inaccurate, irrelevant, or inappropriate.
- Include private details copied from an uploaded document.
- Export a file that looks different from the editor preview.
This risk becomes more serious when the visual discusses health, personal finance, legal rights, public safety, education policy, or another subject that could affect an important decision. In those situations, obtain qualified human review before publication.
AI Infographic Generator Checklist: 12 Checks Before You Publish
Work through the following checks after generating the first visual and again after completing your edits. Do not assume that a correction made in one section has automatically updated every related chart, label, or summary.
Define the Audience, Purpose, and Format
Decide what the visual must accomplish before reviewing its details.
- Who is the intended reader?
- What should the reader understand or do?
- Will it appear on a website, social platform, report, handout, or presentation?
- Will most people see it on a phone, computer, or printed page?
- Is it educational, promotional, instructional, or informational?
A tall social graphic needs larger text and fewer details than a printable report. A classroom handout may need definitions and sources that a promotional image does not.
Compare the Visual With the Original Source
Place the generated infographic beside the original article, report, document, or dataset.
- Check that no essential section was omitted.
- Confirm that cautious language was not turned into certainty.
- Look for information that was added without support.
- Make sure opinions were not presented as established facts.
- Check whether limitations and exceptions remain visible.
When the source is a long document, create a source map that records the page, table, section, or dataset row behind every number and conclusion before converting the material into a visual.
Verify Every Important Fact, Name, and Date
Independently check every detail that could affect the reader’s understanding.
- Names of people, products, organizations, and locations
- Dates, deadlines, time periods, and historical events
- Definitions and technical terms
- Prices, plans, features, and availability
- Quotations and attributed statements
- Laws, regulations, policies, and eligibility rules
Prefer the original source, official documentation, government publication, or research paper rather than another summary that may have repeated an error.
Trace Statistics and Claims to Reliable Sources
Every meaningful statistic should be traceable to a real source.
- Confirm the publisher or research organization.
- Check the publication and data-collection dates.
- Review the sample size and geographic scope.
- Check what was measured and how it was defined.
- Confirm that the source supports the exact displayed claim.
- Add a clear source label near the relevant data.
Avoid vague citations such as “research shows” or “according to experts.” A reader should be able to identify and locate the supporting material.
Recalculate Percentages, Totals, and Comparisons
Do not trust a calculation only because it appears inside a professional design.
- Recalculate percentages, totals, averages, and ratios.
- Separate percentage changes from percentage-point changes.
- Check currency, unit, and measurement conversions.
- Confirm that rounded values remain accurate.
- Check whether categories add up to the stated total.
- Recreate any number used in the main conclusion.
Keep a small verification table while reviewing the visual. This creates a record of which values were checked and which still need correction.
Inspect Charts, Axes, Units, and Proportions
A chart can use correct numbers and still create a misleading visual impression.
- Confirm that the chart type suits the comparison.
- Check axis labels, units, intervals, and time periods.
- Make sure legends match the correct colors or categories.
- Look for truncated axes that exaggerate small differences.
- Avoid decorative 3D effects that distort proportions.
- Check that icons and pictograms scale honestly.
- Confirm that the written conclusion matches the chart.
Apply the same standard to every chart: the visual form must support the comparison rather than exaggerate it.
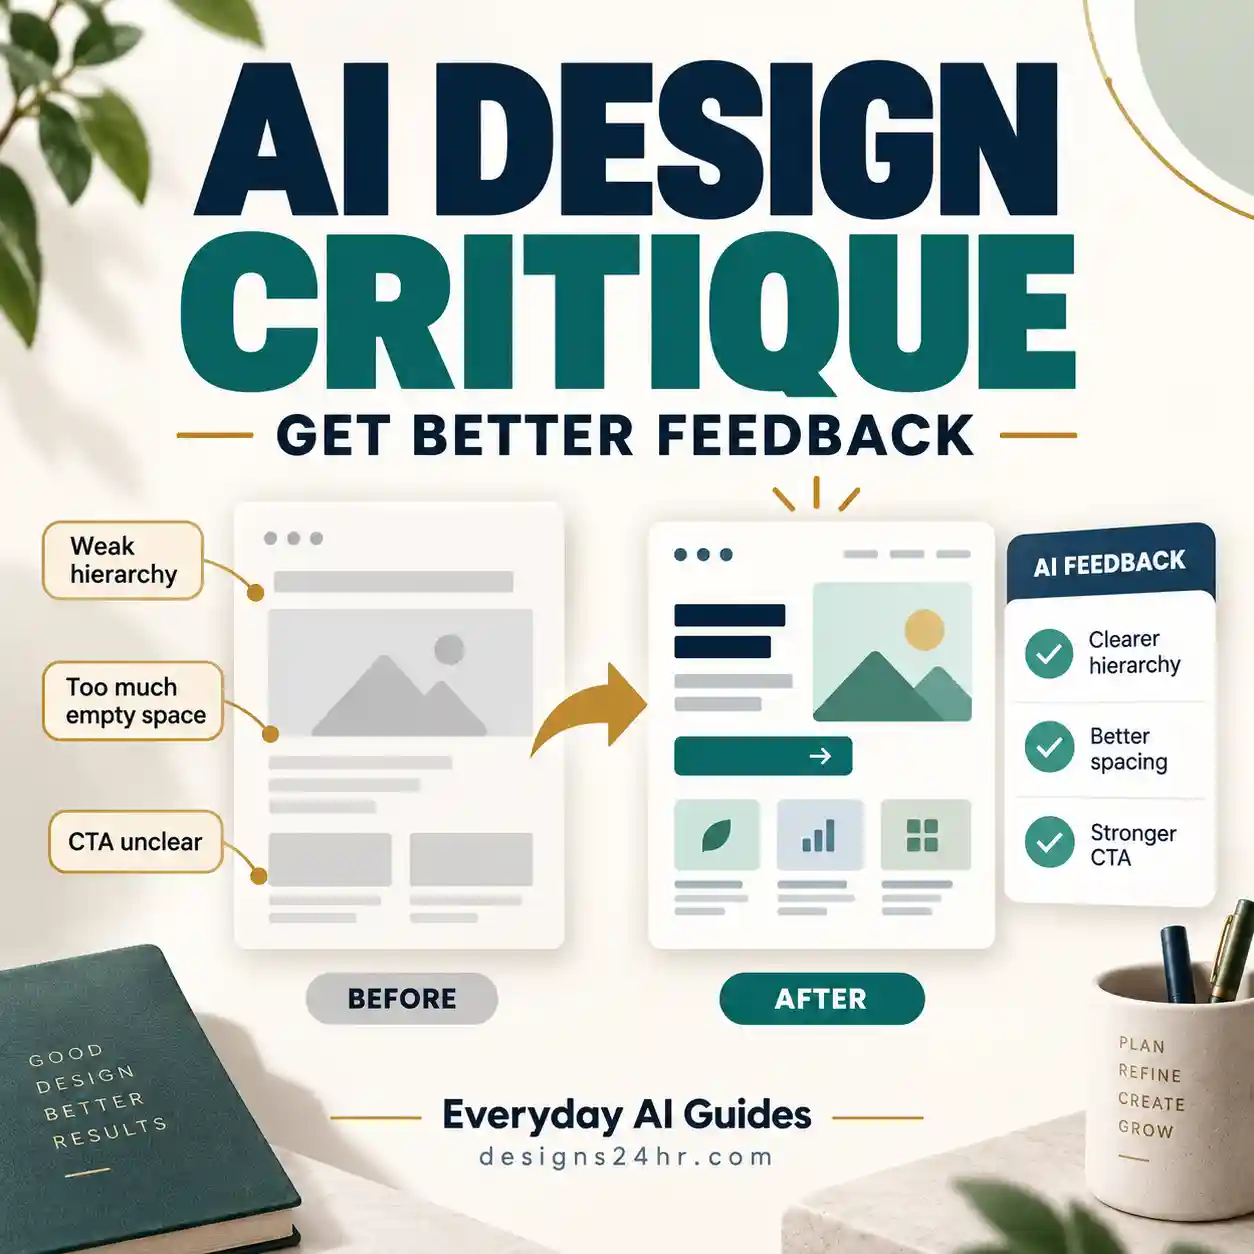
Simplify the Text and Strengthen the Hierarchy
The reader should understand where to begin and what matters most.
- Use one clear main message.
- Shorten headings without changing their meaning.
- Remove repeated explanations and generic filler.
- Keep supporting text concise.
- Use consistent alignment and spacing.
- Make the reading order obvious.
- Leave enough white space around important information.
Do not squeeze a full article into small visual cards. The infographic should summarize the material while the surrounding webpage provides detail and supporting evidence.
Test Readability, Contrast, and Mobile Display
Inspect the visual at its actual publishing size, not only while zoomed into the editor.
- Check headings, labels, notes, and source text.
- Use adequate contrast between text and its background.
- Do not communicate essential meaning through color alone.
- Test the infographic on a real mobile screen.
- Check for cropped edges in social-media previews.
- Make sure decorative backgrounds do not reduce readability.
- Confirm that links and QR codes remain large enough to use.
For web use, the W3C contrast guidance specifies at least 4.5:1 for normal text and 3:1 for qualifying large text. Treat these as minimum thresholds, then test the final graphic at its real display size.
Add Alt Text and a Text-Based Alternative
Important information should not be available only inside the image.
- Write concise alt text describing the topic and purpose.
- Provide the main findings as normal webpage text.
- Include a data table when exact values matter.
- Place detailed explanations near the image or link to them clearly.
- Avoid stuffing every visible word into the alt attribute.
W3C guidance for complex images recommends a short description that identifies the image plus a longer text alternative containing the essential values, relationships, and conclusions.
Review Images, Icons, Copyright, and Trademarks
Inspect every generated, uploaded, and imported visual asset.
- Remove watermarks and assets with unclear licenses.
- Do not copy another creator’s infographic or template.
- Avoid protected characters, artwork, product packaging, and logos.
- Do not imply endorsement, sponsorship, certification, or official status.
- Check whether generated people, objects, and locations are represented accurately.
- Review the tool’s current commercial-use and licensing terms.
The U.S. Copyright Office’s AI resources explain that copyright protects human-authored expression. Depending on the work, human selection, coordination, arrangement, editing, or other expressive changes may be relevant, while prompts alone do not automatically establish authorship of every generated element.
Apply the approved brand colors, typography, image treatment, and layout rules only after the source material and visual claims are correct.
Protect Personal and Confidential Information
Review both the uploaded source and the generated visual for sensitive information.
- Remove customer, student, employee, or patient details.
- Do not upload confidential client reports without authorization.
- Hide account numbers, email addresses, and private identifiers.
- Check screenshots for open tabs, alerts, names, and notifications.
- Review the tool’s privacy, retention, and training settings.
- Use fictional or anonymized information in demonstrations.
The NIST Privacy Framework provides a risk-based approach for identifying and managing privacy risk. It is a planning resource, not a replacement for the laws, contracts, consent requirements, or organizational policies applying to your source material.
Export, Resize, and Complete a Final Human Review
The editor preview is not the final product. Inspect the actual downloaded file.
- Export the required PNG, WebP, PDF, or other file format.
- Close the editor and open the downloaded file separately.
- Inspect it at 100% size.
- Check sharpness, cropping, spacing, and alignment.
- Test it on desktop and mobile.
- Proofread every visible word.
- Test links and QR codes.
- Confirm final human approval before publishing.
Use the free Image Resizer and Converter to prepare a lighter WebP, PNG, or JPEG version after the approved master file has been exported. Keep the original proportions when creating platform-specific versions.
Build a Claim-to-Visual Evidence Log
Record every headline claim, chart, and highlighted number before publication. The log should connect the visible statement to its original source, calculation, visual treatment, and final reviewer. The example values below are fictional and demonstrate the method only.
| Displayed claim | Source and scope | Calculation or context check | Visual check | Final decision |
|---|---|---|---|---|
| 42% of respondents | Survey table: 525 of 1,250 respondents | Percentage and sample size recalculated | Label must include the sample size | Approve after adding “n=1,250” |
| Sales increased 18% | Internal report: $50,000 to $59,000 | Change recalculated as 18% | Bar chart uses a labelled zero baseline | Approved |
| Up by 12% | Rate changed from 40% to 52% | Difference is 12 percentage points, not 12% | Headline and chart annotation need correction | Revise before publication |
| 2026 industry average | Source published in 2023 using 2022 data | The date does not support a 2026 claim | Current-year badge is misleading | Replace the source or label the older period |
Hard-stop rule: Do not publish when the main conclusion, denominator, time period, central calculation, chart axis, source, privacy review, or accessible text alternative is missing or cannot be verified. A high-quality layout does not compensate for a failed evidence check.
The FACTS Test: A Fast Final Review
Use the FACTS Test as a final scan after the detailed review. It is not a substitute for opening sources, recalculating data, or checking the exported file.
Verify the main facts, dates, statistics, calculations, and conclusions.
Check charts, units, contrast, reading order, alt text, and mobile readability.
Make sources traceable and confirm that visual assets are appropriate to use.
Make every heading, label, note, and source line clear at the final size.
Open the exported file, test its destination, and obtain final human approval.
AI-Generated Draft vs. Publishing-Ready Infographic
| AI-generated draft | Publishing-ready infographic |
|---|---|
| Statistics are accepted automatically. | Important statistics are checked against original sources. |
| A chart is selected because it looks attractive. | The chart type, axes, units, labels, and proportions are reviewed. |
| Sources appear in a generic footer. | Claims are connected to identifiable and reliable sources. |
| Text looks readable while zoomed into the editor. | Text is tested at the actual desktop and mobile display sizes. |
| Generated images and icons are used without inspection. | Rights, relevance, accuracy, and consistency are checked. |
| Color alone identifies categories. | Labels, patterns, or other cues communicate the same meaning. |
| Uploaded information remains in the visual. | Personal, confidential, and unnecessary information is removed. |
| The design is reviewed only inside the generator. | The exported file is reopened, proofread, resized, and tested. |
Copyable AI Infographic Review Prompt
You can ask an AI assistant to help identify possible problems, but its review should support—not replace—your own source checking.
COPY AND PASTE THIS PROMPT
Act as a critical infographic reviewer. Review the supplied infographic text, data, source list, and chart descriptions for factual errors, unsupported claims, incorrect calculations, misleading chart choices, missing axes or units, weak source attribution, repeated wording, unclear hierarchy, accessibility problems, copyright or trademark concerns, privacy risks, and unclear conclusions. Separate confirmed issues from items that require human verification. Explain why each issue matters. Do not invent corrections, statistics, quotations, or sources. When evidence is missing, clearly say that the claim could not be verified.
Start from a written brief that names the audience, destination, main conclusion, source set, required data, chart limits, accessibility alternative, and final reviewer. Keep the original source material available so every suggested correction can be checked.
The Five-Minute Final Human Review
Complete this final sequence after the infographic has been exported. Reviewing the independent file helps reveal problems that may not be obvious inside the design tool.
- Read only the headline and major statistics. Confirm that they communicate the correct main conclusion.
- Compare every highlighted number with the source. Recheck calculations and time periods.
- Scan every chart. Check axes, units, labels, scales, colors, and proportions.
- Read all visible text at actual size. Fix tiny labels, dense paragraphs, and weak contrast.
- Inspect images and branding. Remove questionable logos, watermarks, protected assets, and irrelevant generated imagery.
- Search for private details. Check screenshots, source notes, filenames, and footer information.
- Test the exported file. Open it on mobile and desktop and test any links or QR codes.
- Ask another person to review it. A fresh reader may notice confusing wording or missing context.
Important: A visually polished infographic can still contain harmful misinformation. Do not publish medical, financial, legal, safety, or public-policy guidance without appropriate source verification and qualified human review.
Common AI Infographic Mistakes to Avoid
- Starting with an unclear prompt: The tool fills missing details with assumptions.
- Using AI-generated citations: The source may not exist or may not support the claim.
- Mixing multiple datasets: Figures may use different definitions, years, or populations.
- Overloading the design: Too many sections make the main message difficult to find.
- Using decorative charts: Visual effects can make small differences appear more important.
- Making source text too small: A citation is not useful when readers cannot read it.
- Relying on color alone: Categories become difficult to understand for some readers.
- Ignoring the exported image: Text and edges may become blurry or cropped.
- Assuming commercial use is automatic: Tool and asset licenses vary.
- Publishing without human approval: The creator remains responsible for the final message.
How to Cite Sources in an Infographic
Place a short, readable source label near the relevant statistic or section. Use the accompanying webpage, report, caption, or reference section for the complete citation.
A useful source reference may include:
- Author or organization
- Title of the report, dataset, or webpage
- Publication date
- Relevant table, page, or section when available
- Direct link in the webpage version
- Date accessed when information changes frequently
Do not place one unrelated list of sources at the bottom and expect readers to guess which source supports each statement. Connect the source to the specific claim whenever possible.
Marketing infographic? Claims about a product, service, result, or performance should be truthful, non-deceptive, and supported by appropriate evidence. Review the FTC advertising and marketing guidance and avoid absolute promises such as “guaranteed,” “100% accurate,” or “works for everyone” unless reliable evidence supports the complete claim.
Frequently Asked Questions
What is an AI infographic generator?
An AI infographic generator is a tool that uses artificial intelligence to turn a prompt, text, document, or dataset into a visual layout. It may suggest headings, summaries, icons, charts, colors, and an overall structure. The generated result should be reviewed and edited before publication.
Are AI-generated infographics accurate?
Not automatically. An AI-generated infographic may contain incorrect facts, invented citations, altered statistics, misleading charts, or missing context. Accuracy depends on the source material, the tool, the instructions, and the quality of the final human review.
Can AI turn text or a document into an infographic?
Many tools can transform pasted text, prompts, documents, or structured data into a visual draft. Capabilities vary, so check which file formats are supported, how uploaded information is handled, whether the content remains editable, and which export options are available.
How do I fact-check an AI-generated infographic?
Compare the visual with the original source, verify important claims through reliable references, recalculate statistics, inspect chart scales, and check dates, names, quotations, definitions, and conclusions. Do not rely on the same AI system to verify its own unsupported output.
How should I cite sources in an infographic?
Add a brief source label close to the relevant statistic or claim, then provide the complete source in the surrounding article, report, caption, or reference section. Include enough detail for readers to identify and locate the original material.
Can I use an AI-generated infographic commercially?
Commercial-use rights depend on the generator’s current terms, the source material, imported assets, generated content, stock licenses, fonts, logos, and the level of human creative contribution. Review the applicable terms and seek professional advice when the legal status is important.
What is the best file format for an infographic?
WebP is useful for lightweight website graphics, PNG is useful for sharp text and transparency, JPEG may work for image-heavy visuals, and PDF is often suitable for printing or document sharing. Always confirm the requirements of the destination where the infographic will be used.
How do I make an infographic accessible?
Use readable text, strong contrast, clear headings, logical reading order, descriptive labels, and more than color alone to communicate meaning. Add concise alt text and provide the important facts, conclusions, and data in normal webpage text or an accessible table.
What should infographic alt text include?
Alt text should briefly identify the infographic’s subject and purpose. For a complex or data-heavy visual, provide the detailed findings, values, and relationships elsewhere on the page rather than trying to place every detail inside the alt attribute.
Should I disclose that AI helped create the infographic?
Disclosure requirements vary by employer, client, school, platform, publication, industry, and location. Follow the rules that apply to your situation. Disclosure is especially helpful when readers could otherwise misunderstand how the content or imagery was created.
What is the difference between an AI infographic and an AI presentation?
An infographic usually communicates one structured visual summary that can stand alone on a webpage, social platform, handout, or printed page. A presentation is a sequence of slides designed around timing, spoken delivery, transitions, and audience interaction. Both require evidence and accessibility review, but their layouts and delivery checks are different.
Can I publish an AI-generated infographic without listing sources?
Decorative or process-only graphics may not contain factual claims, but any meaningful statistic, quotation, research conclusion, comparison, product-performance claim, or current fact should be traceable to an appropriate source. Put short source labels near the relevant claims and provide complete references in the surrounding page or report.
Authoritative Resources
Final Takeaway
An AI infographic generator can reduce the time needed to organize information and produce a visual first draft. It cannot take final responsibility for the accuracy, fairness, accessibility, privacy, or legality of the published result.
Use this AI infographic generator checklist to compare the design with its original sources, verify every important number, inspect charts and labels, improve readability, protect sensitive information, review image rights, and test the exported file.
The most reliable infographic is not simply the one that looks professional. It is the one whose information can be understood, checked, and trusted.
Publish Only After the Evidence and Export Agree
The headline, visible numbers, charts, source labels, accessible text alternative, and downloaded file should communicate the same verified conclusion.
General-information notice: This guide provides a practical review process and does not constitute legal, medical, financial, compliance, or professional advice. Tool features, policies, licenses, prices, and privacy practices can change. Review the current terms and obtain qualified advice when necessary.